


Jim Dickinson | 4 April 2024
It’s the money it gives to the Office for Students (OfS) to give to providers on top of the money they raise from the tuition fee to “support successful student outcomes”.
This piece was originally published in Feb 2023. I’ve updated it both with the 23/24 numbers and the recent announcement on the magic money twig student premium for 24/25.
In the earlier part of the last decade it was like an HE version of the pupil premium, and these days it’s lazily (and craftily) rebranded as “hardship funding” every time the government is asked a question about student finance.
One aspect of the twig – other than its repeated deployment and ever broadening purposes – is the way in which the total has reduced both in real terms and in actual terms. Here’s the figures since 2018:
| FT Core | FT Supplement | PT | Disabled | Extra | TOTAL | |
|---|---|---|---|---|---|---|
| 2018/19 | 154,061 | 20,834 | 71,953 | 41,653 | £289m | |
| 2019/20 | 154,431 | 20,540 | 72,221 | 42,044 | £289m | |
| 2020/21 | 141,522 | 20,791 | 67,656 | 42,044 | 80,000 | £352m |
| 2021/22 | 131,249 | 19,036 | 66,367 | 39,732 | 16,997 | £273m |
| 2022/23 | 134,519 | 19,507 | 66,804 | 40,502 | 14,749 + 15,000 | £292m |
| 2023/24 | 134,516 | 19,506 | 66,835 | 40,504 | 14,750 + 10,000 | £287m |
| 2024/25 | £282m |
As you can see, the total this year once we add in the £15m extra that ministers keep bragging about is still lower than that allocated in 2018 – and as I say, these days the funding isn’t just supposed to support providers to support those most at risk of dropping out – it’s to fill in the gaps left by insufficient maintenance too.
Last week it was announced that it will be increased (ie cut in actual terms once you discard the in-year extras of this year, and therefore slashed in real terms) to £282m – still lower than 2018 in cash terms.
But as well as its broadening purposes and decline in value in real terms, we have never really looked at how many students it’s being spread between.
Given higher education gets better each year at widening participation, does it stand to reason that even the declining pie is being sliced ever thinner too?
The basic way of calculating the slice hasn’t changed in donkey’s. Basically we’re looking here at undergraduate students who are deemed to be most at risk of withdrawing from their studies because of their qualifications and age profile, and who therefore require additional investment to ensure their retention and success.
The allocation includes a supplement that recognises students from areas of the country with low levels of higher education participation or qualification, and end up being made in proportion to “weighted FTEs”.
So you end up with 12 risk categories, weighted according to:
- Age – ‘young’ (aged under 21) and ‘mature’ (aged 21 or over on entry).
- Qualification aim (those aiming for a first degree and those aiming for another undergraduate qualification).
- Risk associated with entry qualifications (low, medium and high).
Next there’s a supplementary allocation that focuses funding on providers with the most students from underrepresented areas, incorporating two provider weightings:
- A weighting based on the proportion of students who are at risk of withdrawing from their studies (reflecting the 12 risk categories).
- A weighting based on the proportion of students who are both at risk and from the most underrepresented areas.
The Part Time UG allocation is more straightforward – done on numbers alone – and the Disabled allocation is done on a weighting that reflects the proportion of their UK students who receive DSA (weighted at 2) or who self-declare a disability (weighted at 1).
Any extras in year get based on the above, and there’s no allocations for anyone else – even though it’s clear that providers are allowed to (and often encouraged to) spend the money on whoever they like.
Anyway – what’s extraordinary is the way in which the amounts allocated per weighted FTE have declined sharply since 2018. Remember these are raw numbers – the decline in real terms is much sharper for obvious reasons:
| FT Core | FT Supplement | PT | Disabled | |
|---|---|---|---|---|
| 2023/24 | 152 | 164 | 772 | 124 |
| 2022/23 | 148 | 161 | 799 | 128 |
| 2021/22 | 147 | 158 | 896 | 127 |
| 2020/21 | 155 | 174 | 896 | 146 |
| 2019/20 | 175 | 181 | 1002 | 158 |
| 2018/19 | 189 | 193 | 1070 | 174 |
Particularly egregious is the cut in actual terms (and the even bigger one in real terms) for disabled students – of 29 per cent per student since 2018, or 43 per cent per student in real terms. Unless the trend lines on disabled students have changed, that’ll be even less as a result of today’s announcement.
Thanks to the current government, over the past six years students have ended up getting less invested in their education but will be paying more (back); they’re getting less to live on yet paying more back in maintenance; and their universities are getting less money to help those most at risk of dropping out, while expecting that money to be spent on more things and more students. What a scam.
And more importantly, if providers are supposed to allocate money from their fee income to spend on access and participation on the basis of what works, how on earth can they make predictions over 4 years when the top up from government that goes into the same pot varies every year? If OfS’ allocation per student changes every year, surely it should require an Access and Participation Plan variation every year to account for the difference?
CONTINUE READINGJim Dickinson | 22 March 2024
I’d rather naively assumed that the speech would resemble those that OfS have been giving at other sector events over the past six months or so – but this one was surprisingly rich with signals about where the regulator is intending to focus next.
The big theme was acting in the student interest and how OfS is intending to expand and improve the work it does with students.
After the usual sector-specific hat tip on how amazing college HE is, Lapworth framed much of the content around its emerging response to the Lords Industry and Regulators Committee report:
…we too have come to recognise that our understanding and communication of the student interest has not always been strong enough or consistent enough for our regulation to be visible to students and for them to feel the confidence in our regulation they should.
Lapworth said that students have “serious questions” about the amount of teaching they receive, the frequency and usefulness of feedback provided to them, and the level of support, both academic and pastoral, they can access – and said that students deserve to receive what they were promised by their provider when they chose their course:
We want to see that spelt out with greater clarity, and students confident they can hold providers to account for it.
That sounds like the endlessly delayed stuff on consumer protection law – although given the volume of redundancies that providers seem to be making and the dangerously out-of-date Student Protection Plans that seem to accompany each announcement, students will also be hoping for action in that area too.
On its ongoing inspections, Lapwoth signalled some changes to nomenclature (“assessments or compliance assessments, rather than investigations”), additional training for assessment teams and more information about how institutions are selected for assessment and how the process unfolds from there. In the Q&A, she also committed to some summary work on the emerging themes to save everyone wading through each report.
The section on freedom of speech and academic freedom was fairly boilerplate – although the Q&A was trickier given the way in which the legislation accidentally catches all students in OfS providers and their SUs. It sounds like neither OfS nor the Department for Education really understood some of the messier implications of the Act, despite it taking over two years to get onto the statute book.
I’m very much looking forward to Arif Ahmed handling complaints from 11 year olds in some FE colleges that the external speaker they’ve invited needs the College to fund the security, or that the “offensive but otherwise legal” comment they made in class has been clamped down on:
In particular, I know that many of AoC’s members have made points about the age of student union representatives, given that they may be younger than those performing that role in universities.
There was an intriguing section on what students have been saying on OfS’ visits – Lapworth reminded the audience that mental health and access to accommodation have now been bodged into its Equality of Opportunity Risk Register:
[because it is] clear that students are increasingly concerned about the cost, quality and uneven availability of accommodation for their studies. It’s the most frequently mentioned issue in discussions with students in my visits to institutions.
On these sorts of issues, Lapworth stressed that while OfS must be careful not to promise the benefits of regulation that it cannot be confident it can deliver, it may well assume a role:
But we are open to the view that, as a regulator framed and formed in relation to the interests of students, it may fall to us to take action, or to seek to better co-ordinate the activity of others, or to just talk about them because they matter to students.
Hat-tipping John Blake’s new wider role, Lapworth described “the three ins” into OfS’ work for students:
- Student information: what OfS thinks students need to know (or at least have the chance to know) about higher education before, during and after their involvement in it.
- Student input: opportunities for students and their representatives to share what students think OfS needs to know, and hear OfS’ responses.
- Student insight: what OfS thinks it needs to know about what students experience before, during and after higher education in order to properly deliver its regulatory work.
To that end, it’s commissioned new polling and a range of focus groups to expand its insight into students’ experiences and preferences, is extending the terms of current members of its student panel to shape a refreshed approach to student input, and is conducting a thorough review of its student-facing communications to ensure they are relevant, meaningful and engaging.
The best news? There’s going to be a roadshow. A series of strategy development events is coming in the next few months – workshops in May and June in various locations around the country, the dates of which it will be announcing in the next few weeks. I bet you can’t wait.
CONTINUE READINGDavid Kernohan | 21 March 2024
Unbelievable as it may seen, I do get stick occasionally for banging on about data definitions and methodology rather talking about what the data actually says.
In all honesty, some data (including this publication) is just so arbitrary that the actual numbers don’t really matter all that much. But in the interests of keeping the peace here’s a paragraph from my esteemed colleague Michael Salmon:
“The year saw revenue from education-related exports and transnational education (TNE) reach £27.9bn, up from £26.2bn in 2020 – the current UK International Education Strategy aims for this figure to reach £35bn by 2030. Education exports include international students’ tuition fees and living expenses in the UK – these are estimated at £20.65bn for 2021. Pathway providers are assessed to have contributed £0.45bn, and research grants and contracts to have brought in £1.46bn, both figures a slight decrease on the previous two years. The share of TNE income attributable to higher education is £0.89bn, a rise from £0.77bn in 2020.
Sounds guardedly positive and even encouraging in difficult geopolitical and financial times, doesn’t it? Let’s head for the methodology.
Anyway – the first thing you will spot is that 2021 was a long time ago. The original aim was to do 2021 and 2022 on the same day, but because of – you guessed it – problems with 2022-23 HESA Student data this has not been possible. When you look back at the data think back to 2021 – we were just coming out of the main period of Covid restrictions, with every chance of more to come, and international travel was subject to restrictions and otherwise unpopular.
It’s also notable that all these figures are based on exports only – there is no adjustment at all for costs incurred in delivering a service overseas.
There’s been a few tweaks to the fee income calculation (some scholarships are now included, EU-based student fees for those starting after 2021 are now included – with the old cost to government, or RAB, estimates removed). We’ve also updated living cost calculations based on the latest (2021-22) Student Income and Expenditure Survey – but there’s some fairly arbitrary assumptions about the number of weeks a year students of various nationalities and backgrounds are resident in the UK)
On intellectual property income, it is estimated that this constitutes 37.5 per cent of all intellectual property related income as reported in the HESA HE-BCI survey – this figure comes from a London Economics report published in 2011 based on 2008 data! The same paper provides figures for other overseas income – which has simply been uprated based on the changes in performance between 2004-05 and 2008-09, and even back then it was based on 14 survey responses. And as DfE notes “It is… not clear what is covered in this category”.
Finally, for higher education, pathway provider income (programmes that help to prepare overseas students for study at a UK university) is estimated based on a survey of six large providers (CEG, INTO, Kaplan, Navitas, Oxford International, Study Group) conducted by one of the participants (Kaplan).
Incredible as it may seem other bits of the data are even more arbitrary (we don’t know anything about the number of EU domiciled students at FE colleges, there’s no estimate at all for living costs for international students at independent schools, English language study data comes from an actual magazine, education equipment is based on 2020 data (the latest available), and another London Economics estimate from the 00s drives the broadcasting calculation). And do add to this the fact that this is an experimental methodology that is not directly comparable to previous years of data.
None of the above, of course, will stop this data being widely cited in parliament and beyond. Data driven policy, eh?
CONTINUE READINGDavid Kernohan | 21 March 2024
Right, so remember how we got rid of the idea of providers returning funding completion status (FUNDCOMP) back in July 2023? Of course you do – it was clearly the story of the summer, massively overshadowing the resignation of Boris Johnson.
This was all made possible via the possibilities offered by Data Futures – the idea was that getting providers to return two different sets of data on students with different definitions in quick succession was a silly one and a little bit of data magic could ease burden on providers. For this reason, HESES columns 3, 4, and 4a perished. In this transitional year, however, this would mean we would suffer from an absence of student FTE data (including non-completion forecasts).
The plan, therefore, was to derive these figures from the previous (HESES22) year of data. This would be done by a set of multipliers applied to the new (HESES23) figures based on the way things looked in the old (HESES22) figures. With student numbers and attrition rates unlikely to change much in the course of a single academic year, the day was saved.
A multiplier? So, funding allocated by OfS differs based on:
- The level of study (undergraduate and postgraduate provision of various sorts)
- The mode of study (full time, part time, sandwich year)
- The subject area (via a system of price groups, and also specific allocations based on medical and related professions)
- The length of the academic year (standard, or long)
And also takes into account
- Funding completion (basically how many FTE students that started a funded year of study would complete it)
We know all the information in the top list based on HESES23 data, and we have an idea about the likely completion rates (which were, lest we forget, projections) from the HESES22 data. So for each possible category of fundable student, OfS have taken years of engagement from this year’s HESES and made assumptions about what the fundable FTE would be based on current mode and historic projected funded non-completion. This would generally be your own HESES22 data used to make the derivation, unless you didn’t have enough of it in which cases aggregations have been used.
To be honest this was a fudge even in a good year. It has not been a good year.
For what must be the fourth or fifth year in a row, this year has turned out to be one of change and strife in higher education – and therefore assumptions many not hold from last year. So today OfS is offering providers the opportunity to see their calculated multipliers and provide evidence to challenge them should circumstances had changed. For those keeping up at the back, the process of each individual provider recalculating these multipliers to check them is in no way at all more burdensome than just making the usual HESES return.
How would you check whether these assumptions mesh with reality? Well, your HESA Student submission might help – but with this having been delayed, and issues with the platform playing havoc with data quality (and, frankly, staff burnout and attrition), not quite so easy.
If you’ve ever laboured under the impression that we somehow know, as a nation, how many students there are or what they are studying – and that funding was allocated based on this information – I can only offer my apology.
CONTINUE READING
David Kernohan | 20 March 2024
The area-based wonk world has lost its collective mind about a recent release from the Office for National Statistics, which looks at graduate and non-graduate migration using built up areas (and built up area subdivisions) as a unit of analysis.
In the main, this is because ONS has done a stellar bit of data visualisation which has driven a lot of fascinating regional and local storytelling.
We have, of course, been able to look at graduate migration at various levels before. The Longitudinal Educational Outcomes (LEO) dataset that the ONS release is based on has long featured a similar analysis by (ILTS1) region. The Office for Students has provided information about where graduates live (at a provider level!) by travel to work area (TTWA) and, later, lower tier local authority (LTLA).
Built up areas are an innovation here, but the clue to the drawback is in the name – these do not cover the whole country, just built up areas. While this makes sense if you are particularly interested in towns and cities, for me there is equal value in looking for graduates in (and not in) more rural and isolated areas. Also, the way they treat London (just presenting north and south London as two massive units of analysis) is just plain odd. If you, as a Wonkhe reader, were wondering why I didn’t leap on this data as soon as it came out – those are the reasons.
Nevertheless, the data has clearly piqued interest – so let’s have a look at what we get.
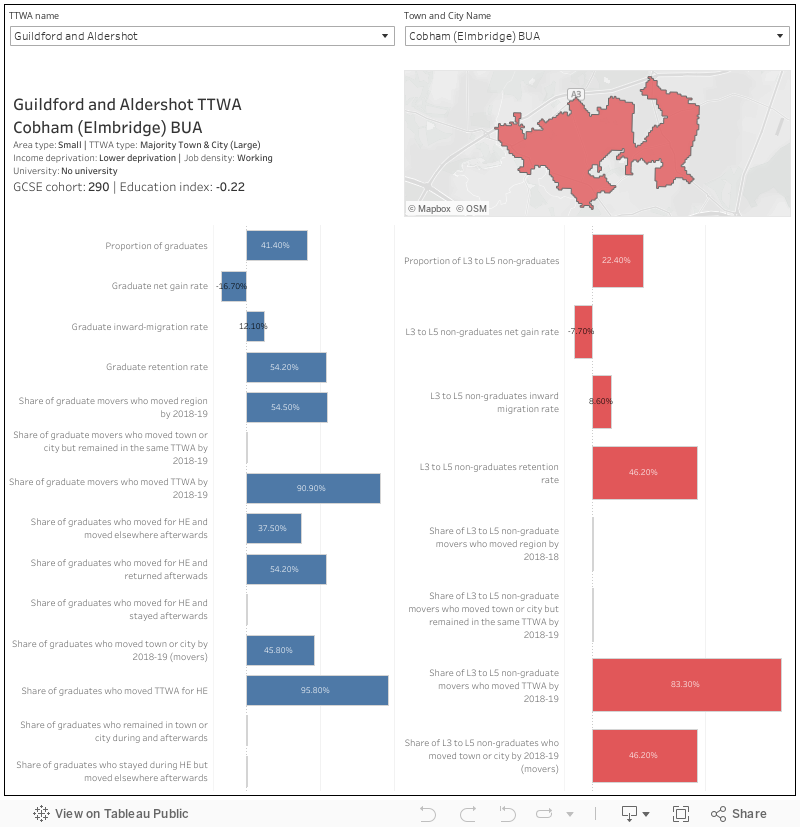
This dash gives you an overview of all the available data – ch0ose the built-up area or subdivision of interest within a travel to work area (TTWA) using the filters at the top. Contextual data is top left, map is top right – below that the data pertaining to graduates is on the left in blue – that pertaining to non-graduates with L3 to L5 qualifications is on the right.
What we are looking at here is the destinations of state-schooled young people from the area in question who sat GCSEs between 2007-8 and 2010-11, as of the 2018-19 academic year. In the contextual bit of my dashboard above you can see a figure for the number of people this pertains to – in some cases this is surprisingly low.
You can see on the main charts the proportion of each cohort who went on to get a graduate-level qualification (level 6 or above) and those who obtained a L3 to L5 (non-graduate) qualification. These are the two groups under analysis – we are not told anything about the movements of people who have their GCSEs as their highest qualification.
For each group we can then see an inward migration rate (the number of people in those GCSE cohorts with those qualifications who had moved to the area by 2018-19), which is used to calculate a net gain (those people minus the number of people from the area who had gained that qualification and no longer lived in the area)
I’ve plotted net graduate gain against net L3-5 gain here: It makes for an interesting perspective on differences within larger areas.
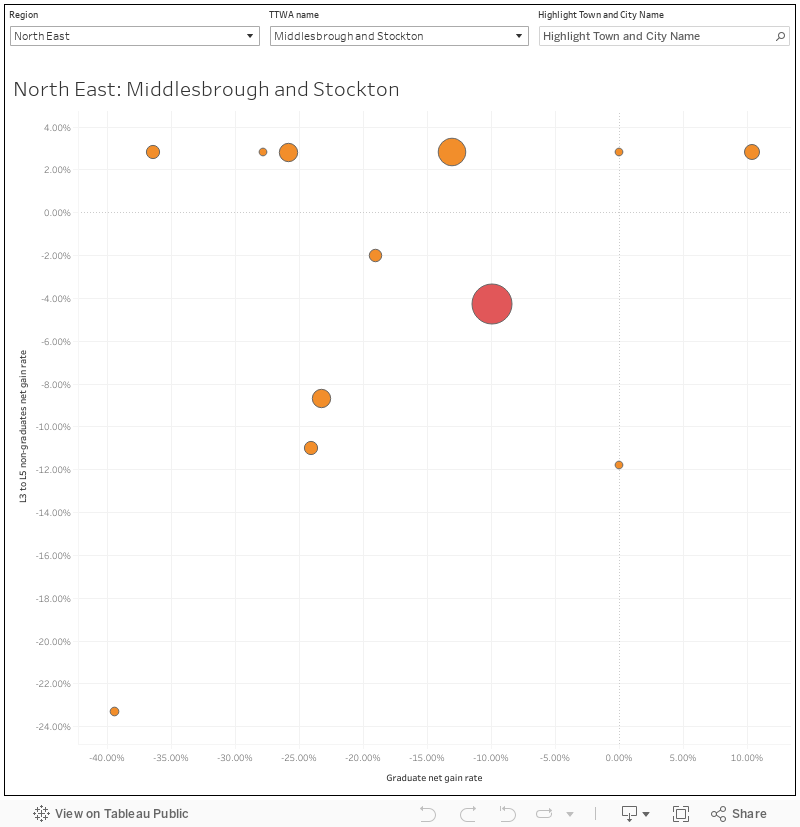
There’s more detail for graduates on whether they moved away to study and stayed their to work, or moved away and then moved again – for both groups we can also see movement between towns in a travel to work area, or between travel to work areas.
What we don’t really see is evidence of brain drain as such – you’ll note in many well-to-do places homegrown graduates tend to have the social capital to move to work elsewhere, while other graduates move to their old home town. Conversely in more disadvantaged areas graduates may end up returning after study – either for family reasons or due to a lack of other options.
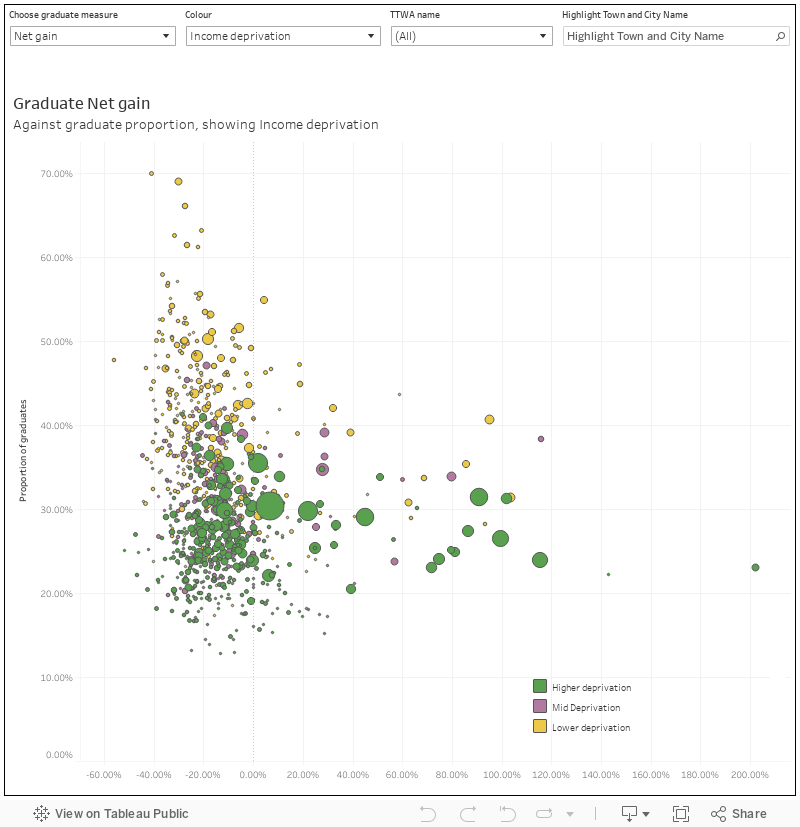
This chart lets you see graduate net gain, graduate inward migration, and graduate retention plotted against the proportion of young people from the cohort who became graduates (a great measure of how middle-class an area is!). You can also choose what the colour shows – whether or not a place has a university, broad deprivation, job density, or the type of area. You can filter by travel to work area.
There’s a bunch of other interesting things here – as you’d expect, a net gain in graduates correlates with having a university in the area, but the impact is not always on inward migration (people coming to study and then staying) as much as it is on retention (graduates from the area staying in the area). And what does appear to drive inward migration is a working area (a place where people come to work rather than just live)
CONTINUE READINGDavid Kernohan | 19 March 2024
The speed and potentially the politicisation of the report on the Graduate visa route commissioned from the Migration Advisory Group has raised eyebrows across parliament.
The annual general meeting of the All Party Parliamentary Group (APPG) on international students offered the opportunity for members and peers to get a sense of just how desperate the plight of providers is getting. Labour stalwart Paul Blomfield sat across from former ministers like Jo Johnson and David Willetts and representatives from every major Westminster party to hear from the affected sectors.
UUKI’s Harry Anderson characterised an “incredibly volatile international recruitment landscape” – though recent Home Office data shows a declining yet reasonably healthy position, beyond the timelapse things are looking bleak. Based on member surveys he suggested that January recruitment was down by more than 40 per cent year on year. “Challenging signals” from the UK government have combined with a high cost of living (and given rising visa fees and NHS surcharges, cost of studying) to make the UK less attractive at just the moment other nations (for example US recruitment is up 11.5 per cent overall and 35 per cent from the key Nigerian market) are moving into a post-pandemic rebound.
There was a sense in which everyone welcomed the idea of an examination of the graduate route – Anderson was clear that the timescales (noting, as Blomfield did, the “extraordinarily robust” response from the Chair Brian Bell) and the likely absence of data would not make for a report robust enough to use to drive policy.
There’s a tendency to see international recruitment as a matter only for the bigger and more established universities – a view that is at least five years out of date. IHE Chair James Pitman has been on the ground with agents in India, where the concerns are all about the potential for changes to the graduate route. Such a dent to international confidence is clearly an issue for universities, but smaller specialist providers are particularly exposed (indeed, IHE provide the secretariat to the APPG, and were kind enough to ask me along).
When the graduate route was closed last time, the sector lost 40 per cent of Indian recruitment in 12 months – with India playing a larger part in recruitment than ever before a similar fall could be catastrophic.
International students are not just an HE issue – the group heard from Emma Meredith from the Association of Colleges on the continued slow decline in FE recruitment. The big ask from FE is regulatory streamlining – currently one bad Ofsted review halts all international recruitment, even at levels of study that Ofsted has no oversight of. For international students Level 4 and Level 5 vocational qualifications (like the flagship Higher Technical Qualifications) need, like at Level 3, 15 hours a week of classroom study – no matter the actual pedagogic requirements of the course.
Rounding out the evidence, Huan Japes made the case for the value and economic impact of English language provision in rural and coastal locations while Simon Nathan from the Independent Schools council noted the value of independent schools in driving business relocation, before laying into Blomfield and Labour about VAT on college fees.
APPG members were very interested in the way that different providers experienced the current downturn, and how (in HE especially) geography and subject areas played in to this. There was also an appetite for benchmarking changes in recruitment with international recruitment, looking at the imposition of restrictions in Australia and Canada against the growing attractiveness of the US. Clearly, runs the argument, international students want to study somewhere – why not the UK?
It felt like the whole room supported the idea of a refresh or relaunch of the DfE International Education Strategy – though this time it would need buy-in from across government, as it currently felt like different departments are pulling in different directions. One example – several HE observers noted the increased time needed to process visa applications, and the increased refusal rate for often arbitrary or inconsequential reasons (now approaching 10 per cent of all student visa applications). It felt to many like the Sheffield wing of the Home Office has been under instructions to put the brakes on. In a few cases start dates for course have been postponed
If you’re of the opinion that universities could make do with less fee income, it was suggested that more than 30 universities have reported (as they are required to) a liquidity of less than 30 days to the Office for Students – and it is likely that more are hovering around the edges of that. If international recruitment pushes a provider into radical cost cutting measures that is to the clear detriment of home students and the local area. The existence of large and well regarded departments in subjects like engineering depends on international students – with a continued downturn in recruitment, we lose them.
Blomfield and the APPG members are out there making the case within all parties for international students – it must be lonely and difficult work. But we should be glad that at least an effort is being made. Something as existential to UK education as this issue needs a bit more noise.
CONTINUE READINGMichael Salmon | 19 March 2024
For one MP on the committee the fact that her daughter supposedly missed out on a place on the Civil Service Fast Stream due to delays in graduation is a key information point. But so far the inquiry has been at its most interesting when considering what mitigations institutions put in place for last summer’s marking boycott, and whether there is a best practice template that should be adopted – or imposed.
Higher education minister Robert Halfon immediately swerved this question in his evidence today, saying that for him there was no “one size fits all” approach to academic regulations.
The evidence from earlier witnesses (Durham vice chancellor Karen O’Brien, King’s College London VP Adam Fagan, and QUB provost Stuart Elborn) highlighted a whole range of things that we already know were put in place in terms of changes to exam boards, replacement markers, provisional assessments based on past performance, no detriment policies, the prioritisation of graduating rather than continuing students, and the like. We are well aware by this point that there was no one consistent approach taken across the sector, and the committee is clearly weighing up whether one should have been taken.
You can sense a likely recommendation to the Office for Students here. Karen O’Brien suggested a “more proactive” approach from the regulator would have been welcomed during the boycott, and thought that the imposing of “emergency regulations” could be a legitimate role for OfS to play during comparable crises in the future. Halfon seemed happy to point to the committee’s eventual recommendations as a good future source of guidance for the regulator and institutions.
Beyond academic regulations, the other thing that was made abundantly clear by the witnesses was the sheer volume of additional work that was created across universities as they sought to mitigate the boycott’s effects. Communicating with parents, employers, other universities that students were looking to progress to, PSRBs. Senior academic staff doing much more assessment themselves than they usually would. Making more counselling sessions available, offering additional study support classes, supplementary careers sessions. Getting in statisticians to crunch students’ expected grades. Goodwill payments. And setting up taskforces and gold teams to monitor and respond to the action all the way through.
There’s a real question here for the sector about just how many staff hours it deployed in all this. Whether institutions would have the resources and energy to act in the same way should the MAB be repeated is a difficult question, and one where there is scope to work out in advance what worked and what didn’t.
Of course, it’s not just universities that put in place mitigations which they should be looking to learn from for possible future rounds. Part of the committee’s inquiry is to assess what the government did beyond higher education to support students graduating late. And it’s not really clear whether much has been learned here.
The Home Office introduced flexibility for international students wanting to move onto the Graduate route – however we learned today that it hasn’t made an assessment of how many students benefited from this or what its impact was. Halfon wasn’t keen on suggesting what OfS could have done differently, largely pointing to the ongoing public body review on questions about the regulator’s performance (which, we learned, is set to report in May).
The minister presented his main role in industrial disputes as bringing “moral pressure” to bear on those involved. He pointed to universities’ autonomy, and on questions about minimum service levels simply referenced the “literally only just finished” (on 30 January) consultation about a consultation that DfE has conducted, stressing the clear differences between schools and universities. For anyone having sleepless nights about potential ONS reclassification it was fairly reassuring.
But for anyone wondering how a possible future marking boycott would play out in institutions, and in the responses of regulators and the government, we’re still pretty much in the dark.
CONTINUE READINGJim Dickinson | 18 March 2024
Over in the US Congress, Republicans Brandon Williams (R-NY) Virginia Foxx (R-NC and Chair of the Education and the Workforce Committee) have introduced the “Respecting the First Amendment on Campus Act”.
Young America’s Foundation (@yaf) enthusiastically welcomes the introduction of the Respecting the First Amendment on Campus Act.
As the premier organization working with conservative students, YAF is all too familiar with the roadblocks our students face when expressing… https://t.co/VmavGnK55B pic.twitter.com/056SLO7NHv
— YAF (@yaf) March 15, 2024
The legislation aims to ensure that universities are fulfilling First Amendment obligations by making free speech on campus a condition of receiving Title IV funding under the country’s Higher Education Act (HEA).
And several of its provisions are eerily familiar to those in England’s Higher Education (Freedom of Speech) Act 2023.
Last Autumn Foxx’s committee published a report similar in tone and framing to the Policy Exchange reports that led to our own legislation – it found that 45 percent of students believe blocking other students from attending a speech is acceptable and more than 25 percent of students believe using violence to stop speech is acceptable.
It also found that 90 percent of college freshman orientation programs include a focus on DEI, while only around 30 percent of orientation programs review the importance of free speech or viewpoint diversity. One in five students said that their college’s stance on free speech was unclear.
What the committee described as a “hostile takeover of postsecondary education” by “political activists, woke faculty, and partisan administrators” has established what they argue is a “dangerous trend that threatens students’ constitutionally guaranteed rights and the ability of campuses to maintain a civil educational environment free of political bias and agendas.”
So the Bill is designed to tackle that. Section 2 all but mandates the use of the University of Chicago’s Chicago Principles and to develop and consistently implement policies accordingly. It also condemns public institutions for conditioning student admission, hiring, reappointment, or promotion of any faculty member, on making a statement of support or opposition to any political ideology, including regarding diversity, equity, and inclusion – not dissimilar to provisions in the HEFoSA on staff appointments.
Just as universities in England will need a (beefed up) Code of Practice, under these proposals every institution eligible to receive Title IV funding will need to certify to the Department of Education (ED) that the institution has annually disclosed to current and prospective students and faculty any policies held by the institution related to association, religion, and speech.
In a country where student clubs are less likely to be organised by an SU and more likely to be sponsored by a staff member, institutions will be barred from denying recognition to a student organisation because the organisation is unable to find a faculty sponsor – and as in the HEFoSA, there will have to be publicly available, clear, objective, content- and viewpoint-neutral standards to allocate funding for recognised student organisations.
They’ve even copied across the security costs panic – institutions will have to make publicly available clear, objective, and content- and viewpoint-neutral standards to determine the security fees assessed for events organised by a student or student organisations. Public universities would not be able to consider the “anticipated reaction by students or the public to the event” in deciding how much to levy in security costs.
The Bill also seeks to protect students’ free association right to join a single-sex social organisation (something covered by the Equality Act here), and they’ve also copied across the “promote” duty – new and transfer students at orientation will have to get an explanation of the First Amendment rights of students, including assurances of the institution’s commitment to freedom of expression and that students and speakers will not have their rights violated. Institutions will also have to provide educational programming at orientation on free speech rights and responsibilities, and post those materials online.
Enforcement is also fun – the Department of Education will get the power to hear complaints from aggrieved individuals or organisations who have been “harmed” by a violation of the requirements of the bill and who have exhausted any available appeals.
Most of the provisions would only apply to public colleges that receive federal financial aid, but private institutions would also have to disclose their speech policies to students, staff and the Education Department every year, and will be compelled to allow single-sex social organisations.
Is the US about to walk headlong into the same see-saw problems that England is in? Almost certainly. Jon Fansmith, senior vice president for government relations and national engagement at the American Council on Education, said the legislation isn’t “helpful” and that it would hamper universities’ ability to tackle hate speech:
It is striking that at a time when the committee’s spending so much effort and attention and focus on protecting students from harmful or hateful speech … that they’re also proposing a bill that would limit almost any ability of an institution to protect those students from that kind of speech…it is dictating institutional practice when these are already really complicated situations that involve numerous factors that aren’t easily understood and that vary based on a case-by-case basis.
Maybe telling politicians that all of this is more complicated than it looks will work in the US. I doubt it, mind.
CONTINUE READINGDavid Kernohan | 18 March 2024
The four UK higher education funding bodies have opened a consultation on REF 2029’s approach to open access policy.
For REF 2029 the team has suggested some tweaks to the 2021 process which are technical in nature but important. There is still an expectation that open access will remain the strong preference for publication barring some exceptions on third party licences, outputs authored prior to the REF 2029 deadline, criteria beyond the control of the institution, and specific challenges determining author relationship to an institution and enforced embargos.
There is a more robust recognition on the technical limitations where any “any outputs meeting UKRI open access policy will be considered to have fully met REF policy however it is not a requirement that all in-scope outputs should meet this standard.”
In REF 2021 there was an embargo period of 12 months for REF panels A and B and 24 months for C and D. Effectively, this meant an author would deposit their output in a repository but the material might not be freely available immediately. The team is proposing that for REF 2029 this period should be shortened to 6 months and 12 months respectively. This is in the belief that open access policy is more generally moving toward more immediate open access.
Attracting the most attention is the policy around the publication of longform outputs. This includes “Monographs, Book chapters, Edited books, Scholarly editions” which would have to be made available after an embargo period of 24 months.
The obvious challenge here is the cost of making books open access within two years particularly if they are selling well. The other issue is the expense in making an entire book open access and who would bear that cost. There is a mooted exemption “Where the only appropriate publisher, after liaison and consideration, is unable to offer an access option that complies with REF policy,” but how this would be assessed consistently is up for debate.
Background reading
At its most simple open access is what it sounds like. It is the availability of research outputs made available free to all.
Open access comes in a variety of forms. There is golden open access wherein an article will be made freely available for anyone to read. And there is green open access wherein academics deposit a version of their article in an open access repository. The models of open access differ between journals but it’s important to note that open access does not mean articles are produced for free. There is generally an Article Publication Charge (APC) which is leveraged on institutions, learned societies, somewhere else, or a combination of people and institutions.
The argument for open access is that it is unjust to gatekeep knowledge through access fees which could have a positive impact on humanity. Martin Eve, a researcher who is committed to open access, wrote for Wonkhe that “Keeping research locked behind paywalls under the assumption that most people won’t be interested in, or capable of, reading academic research is patronising.”
UKRI has a whole open access policy. An article by David Kernohan and Graham Steel in 2017 stated that “All major UK funders now require that research stemming from their funded projects is open access, and open access is a de facto requirement for REF2021. Institutions and research groups regularly require that research outputs are shared openly via an institutional research repository.”
And so it came to pass. REF 2021 made a clear statement that open access was preferable in sharing the total of human knowledge while acknowledging the limitations of software, paywalls, databases, and the wider publishing ecosystem, in making open access possible and demonstrable in every example of publishing.
The REF is not only an exercise in measuring research quality but it is a powerful tool through which research policy is set. Open access is also not only about the dynamics of the publishing industry but a question of who knowledge is produced for and at what costs. Setting exemptions on open access, licensing requirements, and embargo expectations, is also to set a direction for the future of open access more generally.
The consultation is open till 17th June.
CONTINUE READING